Maximizing Muscle Mass: Insights into Growth and Limitations
Key Points
Humans have a natural limit to how much muscle they can build.
How much muscle an individual will be able to grow depends on several variables including age, training status, frame size, and genetics.
Understanding your limit will help manage expectations on the trajectory of muscle growth.
Introduction:
For most of us, adding a substantial amount of muscle mass is a main reason to start resistance training. Novice lifters benefit from being extremely sensitive to muscle gain, despite having less than stellar starting training programs. It is common for gym newbies to gain 5-10 pounds of muscle in their first year of training. However, progress will inevitably slow down, and the realization that you won’t be on the Mr. Olympia stage anytime soon will set in. Plateaus will set in, and gains will become increasingly elusive. While there is a wealth of anecdotal evidence to this phenomenon, it is also substantiated by the scientific literature that underscores the finite nature of muscle hypertrophy.
While understanding the physiological limitation is a worthwhile academic pursuit, it also offers insight into predicting future training outcomes for anyone pursuing a muscular physique. Recognizing the constraints imposed by our biology and genetics can help manage expectations and inform strategic approaches to training. For the most part, given enough time and proper training, athletes can add slabs of muscle onto their bodies. However, an individual’s age, frame size, and genetic predispositions will usually be the limiting factors for how much muscle they’ll be able to grow. In this essay, we will delve into the scientific underpinnings of muscle hypertrophy, exploring how our understanding of its limitations can shape our approach to training and optimize our time in the gym.
I’ll start by explaining the biological mechanisms behind muscle hypertrophy, then I’ll explain a few common limitations, before explaining some popular models that predict muscle potential. Finally, I’ll give some practical takeaways that may make this worthwhile.
HOW MUSCLES GROW
Muscle hypertrophy is the process of increasing muscle cell size. This is most easily and commonly achieved through resistance training. When muscles are subjected to mechanical stress, such as lifting weights, an inflammatory response begins in the body, resulting in the muscle fibers becoming larger. With a proper stimulus, satellite cells (precursors to muscle cells) become activated and contribute to muscle repair and growth through protein synthesis (1). This process is aided by proper nutrition and rest. So, be sure to get enough protein if you are hoping to be cast in the newest Avengers movie.
To keep the stimulus effective for achieving hypertrophy, progressive overload must be achieved. In the context of resistance training, progressive overload means increasing the intensity, duration, frequency, or type of exercise over time to continually challenge the body and promote adaptation and improvement. Progressive overload usually entails progressively increasing the amount of weight lifted, the number of repetitions performed, or the volume (total workload) of the workout. This gradual increase in workload stimulates the muscles to adapt and grow stronger over time, leading to gains in muscle size, strength, and/or endurance. Through this process, muscle protein synthesis (new muscle made from amino acids contained in protein) will usually exceed muscle protein breakdown (the process in which muscle proteins are broken down or degraded), resulting in more total muscle mass for an athlete (1). This process is regulated by signaling pathways such as IGF1, Akt, mTor, and myostatin (1, 2, 3, 4). Hypertrophy is mainly influenced by factors such as mechanical tension, muscle damage, metabolic stress, and the autocrine release of molecules like angiotensin II, and the incorporation of satellite cells (2).
In summary, muscle hypertrophy is achieved through resistance training, which induces an inflammatory response usually resulting in growth. Adequate nutrition and rest, particularly protein intake, are crucial for this process. Progressive overload, gradually increasing exercise intensity, duration, frequency, or type, is essential to maintain stimulus effectiveness. This overload promotes adaptation and improvement by stimulating muscles to grow stronger over time. This will occur until a limitation is hit.
AGE AND TRAINING STATUS
One of the most obvious limitations of hypertrophy is age. For example, a 20-year-old who has never touched a dumbbell will be able to grow more than a 70-year-old. Sarcopenia, the loss of muscle associated with the aging process. That said, elderly individuals can still experience significant muscle hypertrophy, particularly in Type II muscle fibers, with a proper training protocol and status (5). However, muscle hypertrophy in older individuals will be more limited than in their younger counterparts, as shown in a 2012 study by Degens (6).
The Degens study found that limitations in muscle hypertrophy included structural constraints such as tendon, bone, and joint capacity, as well as physiological factors like pennation angle, metabolism, and diffusion limits within muscle fibers. With aging, body parts break down and it is more difficult to support increased amounts of muscle mass. A good way to keep joints and bones healthy and able to support muscle is by making resistance training a routine, and beginning before sarcopenia sets in.
Another common factor that limits how much muscle one can put on is training status. For example, someone who has never trained before will be able to gain more muscle over the first year of training compared to someone who has been in the gym their whole adult life. To understand the growth rate of untrained individuals, we can look at a 2005 study by Hubal et al., which had a sample size of 585 untrained men and women given 12 weeks of resistance training. Of the 585 subjects, 232 subjects, or 40% of subjects, showed an increase in CSA of between 15 and 25%. 10 subjects (2%) were hyper-responders and gained over 40% of CSA, with one subject increasing CSA by 59%. There were some low responders as well, with 36 subjects, or 6% of the sample, gaining less than 5% in CSA. (7).
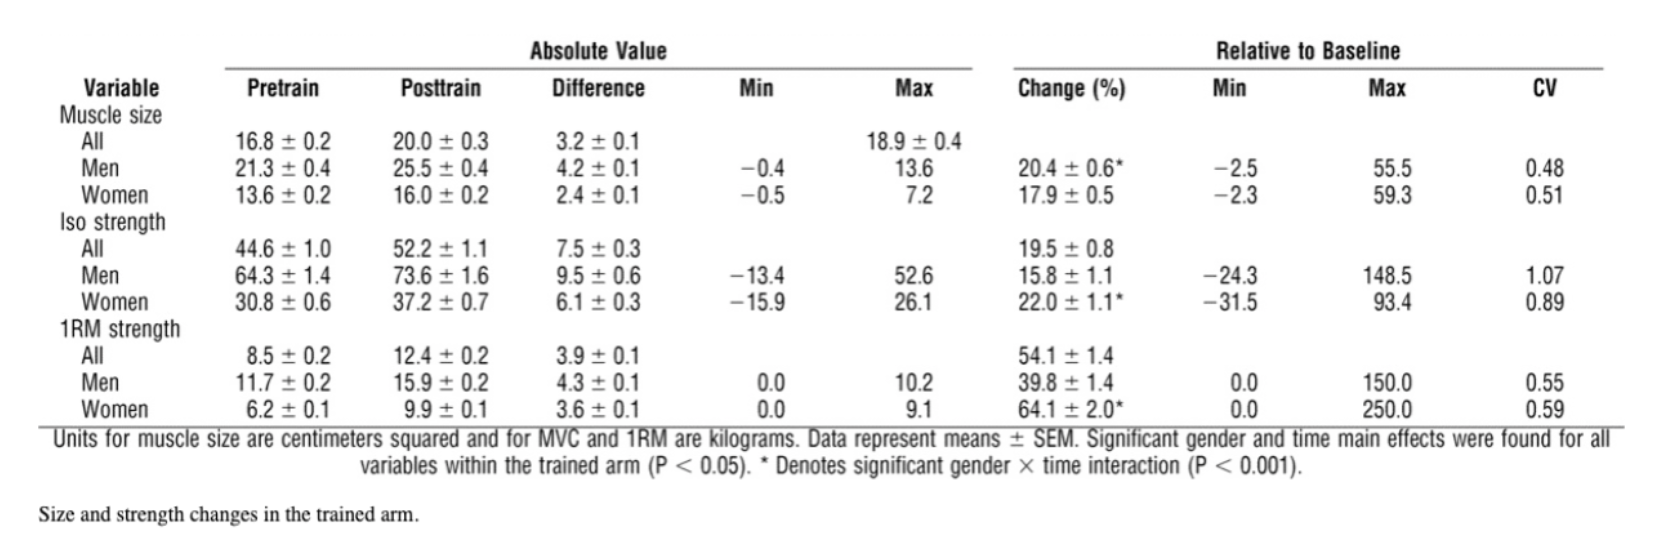
TABLE 1
Size and strength changes in the trained arm.
Source: Variability in Muscle Size and Strength Gain after Unilateral Resistance Training Medicine & Science in Sports & Exercise 37(6):964-972, June 2005.
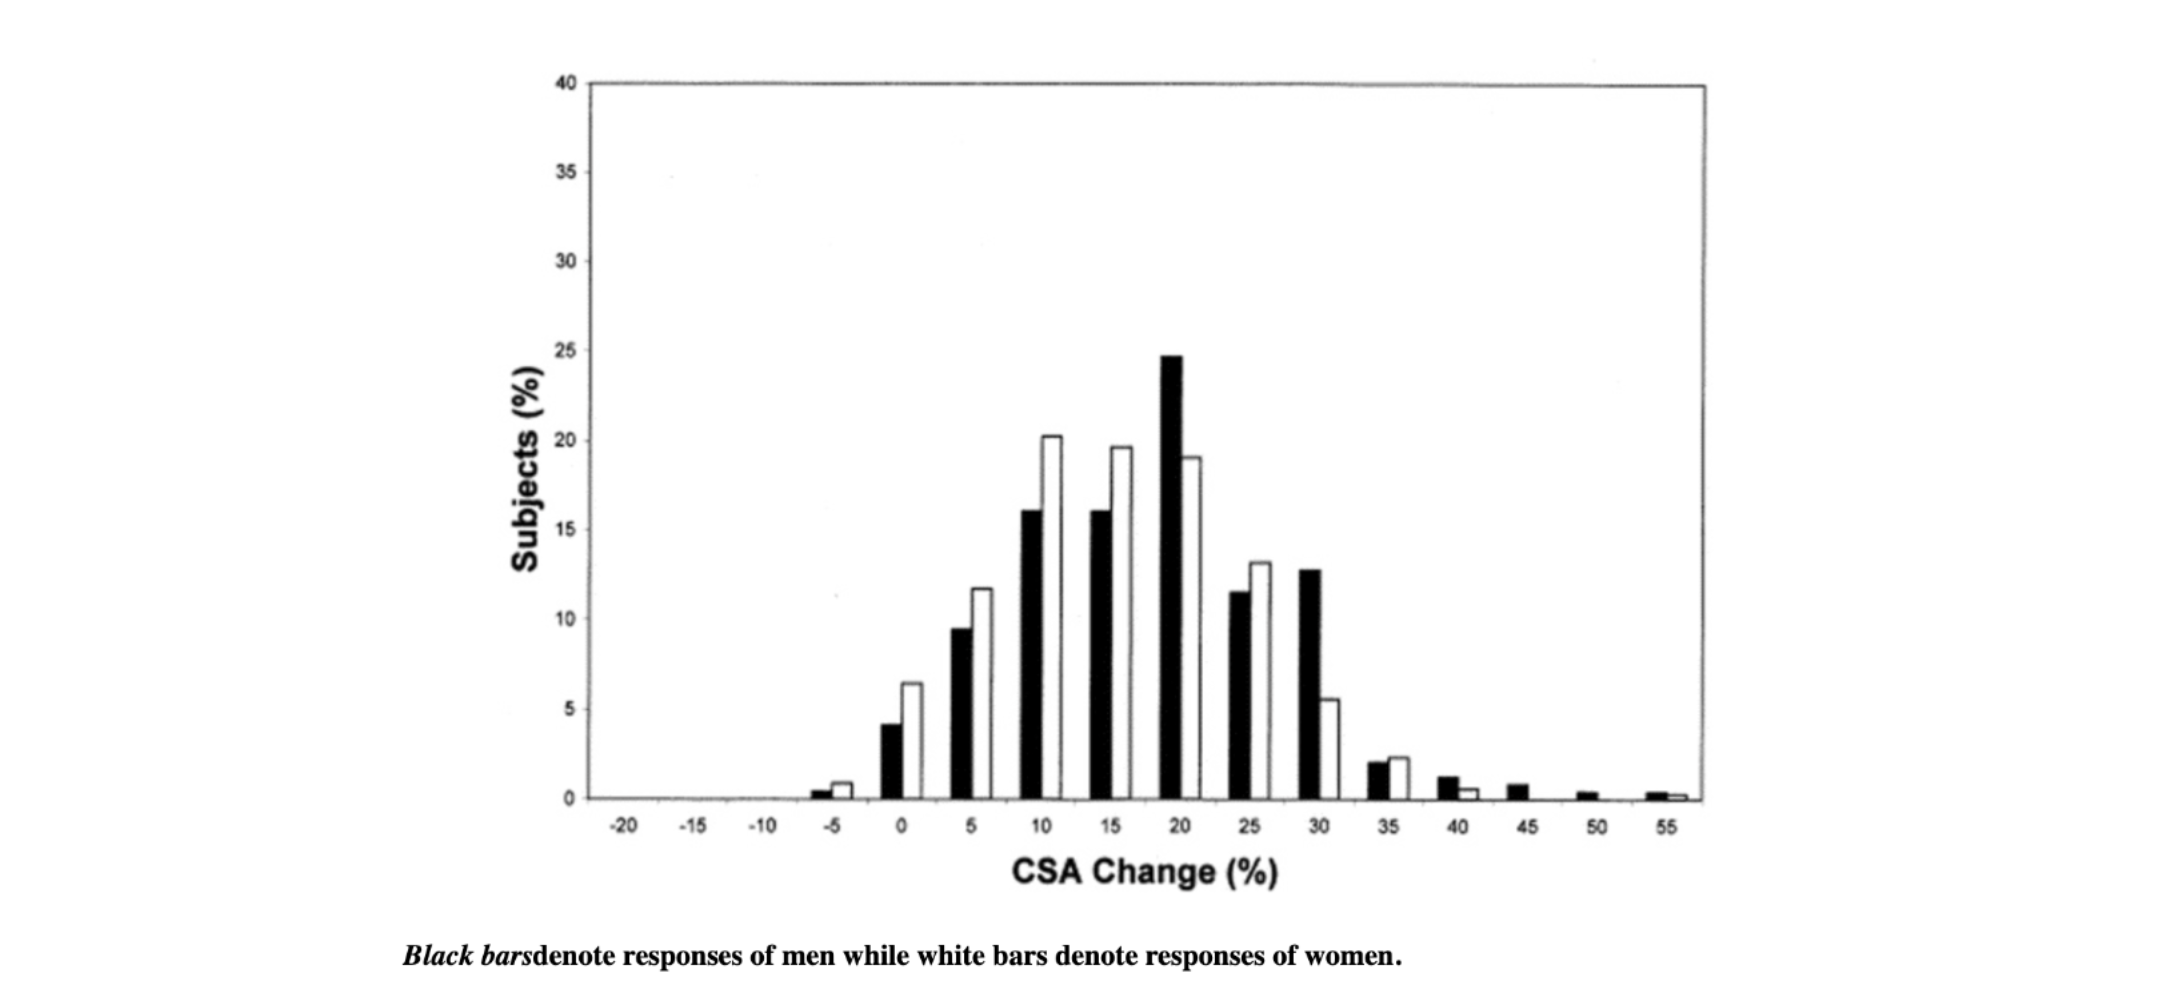
FIGURE 1
Biceps cross-sectional area. Histogram of biceps cross-sectional area changes (relative to baseline) within each gender for the trained arm.
Source: Variability in Muscle Size and Strength Gain after Unilateral Resistance Training Medicine & Science in Sports & Exercise 37(6):964-972, June 2005.
Now if we compare that with a 1996 study by McCall et al, which included 12 trained males completing a 12 week resistance training program, and saw an increase in biceps brachii muscle cross-sectional area (CSA) from 11.8 +/- 2.7 to 13.3 +/- 2.6 cm2, or a little over 12% increase.
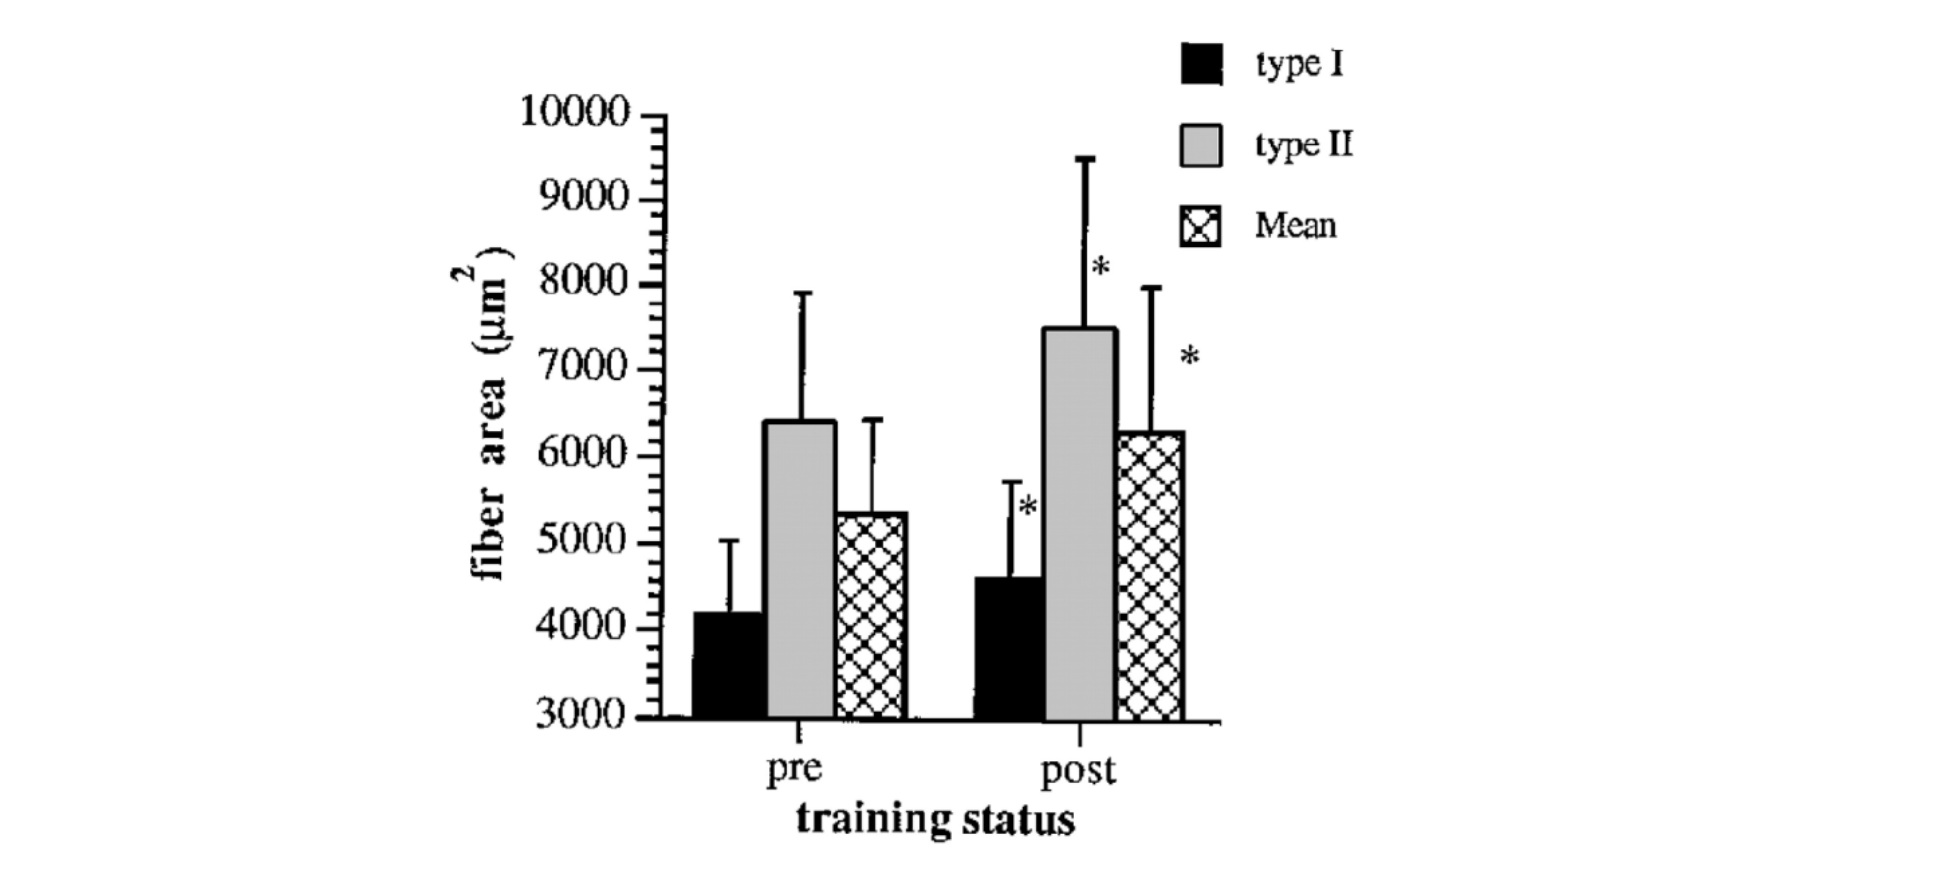
FIGURE 2.
Fiber area values for type I, II, and mean muscle fiber areas pre and post-training. Values are means ± SD;n = 11 subjects.
Source: Muscle fiber hypertrophy, hyperplasia, and capillary density in college men after resistance training.. Journal of applied physiology, 81 5, 2004-12.
So while trained athletes absolutely can still make gains, progress does start to slow down. On the other end of the spectrum, it has been observed that elite weightlifters experienced a non-significant increase in muscle fiber area of 3.9% over an entire year when doing resistance training. This suggests that there is limited potential for strength development in well-trained athletes (9). Anecdotally, with if you’ve been lifting weights consistently for 20 years, it may be unlikely that there is much more potential to grow more muscle. So, shifting your goal from growth to maintenance may be a better use of your time. Understanding where you are in your training journey will be important for managing expectations of how much muscle you can add in a given timeframe.
THE FFMI MODEL
Insofar as being able to calculate muscle potential, the most well-researched model is known as the FFMI, or Fat Free Mass Index Model. The formula is fairly simple, defined by the equation (fat-free body mass in kg) x (height in meters)-squared. A modest correction of 6.3 x (1.8m - height) is added to normalize the value to the height of a 1.8 m man. This calculation for FFMI score can also be found at this link.
Most people will range from a score of 15 (poor) to 30 (difficult to obtain), with an average score of 18-19. As an example, I’m a 6-foot (1.8 m)-tall male, weighing 190 lbs (86 kg), with a body fat percentage of about 14%, and I don’t take steroids. This gives me an FFMI score of about 22.5. A cutoff for a natural athlete (does not use performance-enhancing drugs) is commonly thought to be an FFMI of 25.
The rule of 25 largely comes from a study by Kouri et al (10). Researchers compared the FFMIs of 74 non-steroid users to those of 83 steroid users. The non-user group included some successful drug-free bodybuilders and strength athletes. None of them had an adjusted FFMI over 25. About half of the steroid users had an adjusted FFMI of about 25. So the rule of 25 seems to be good.
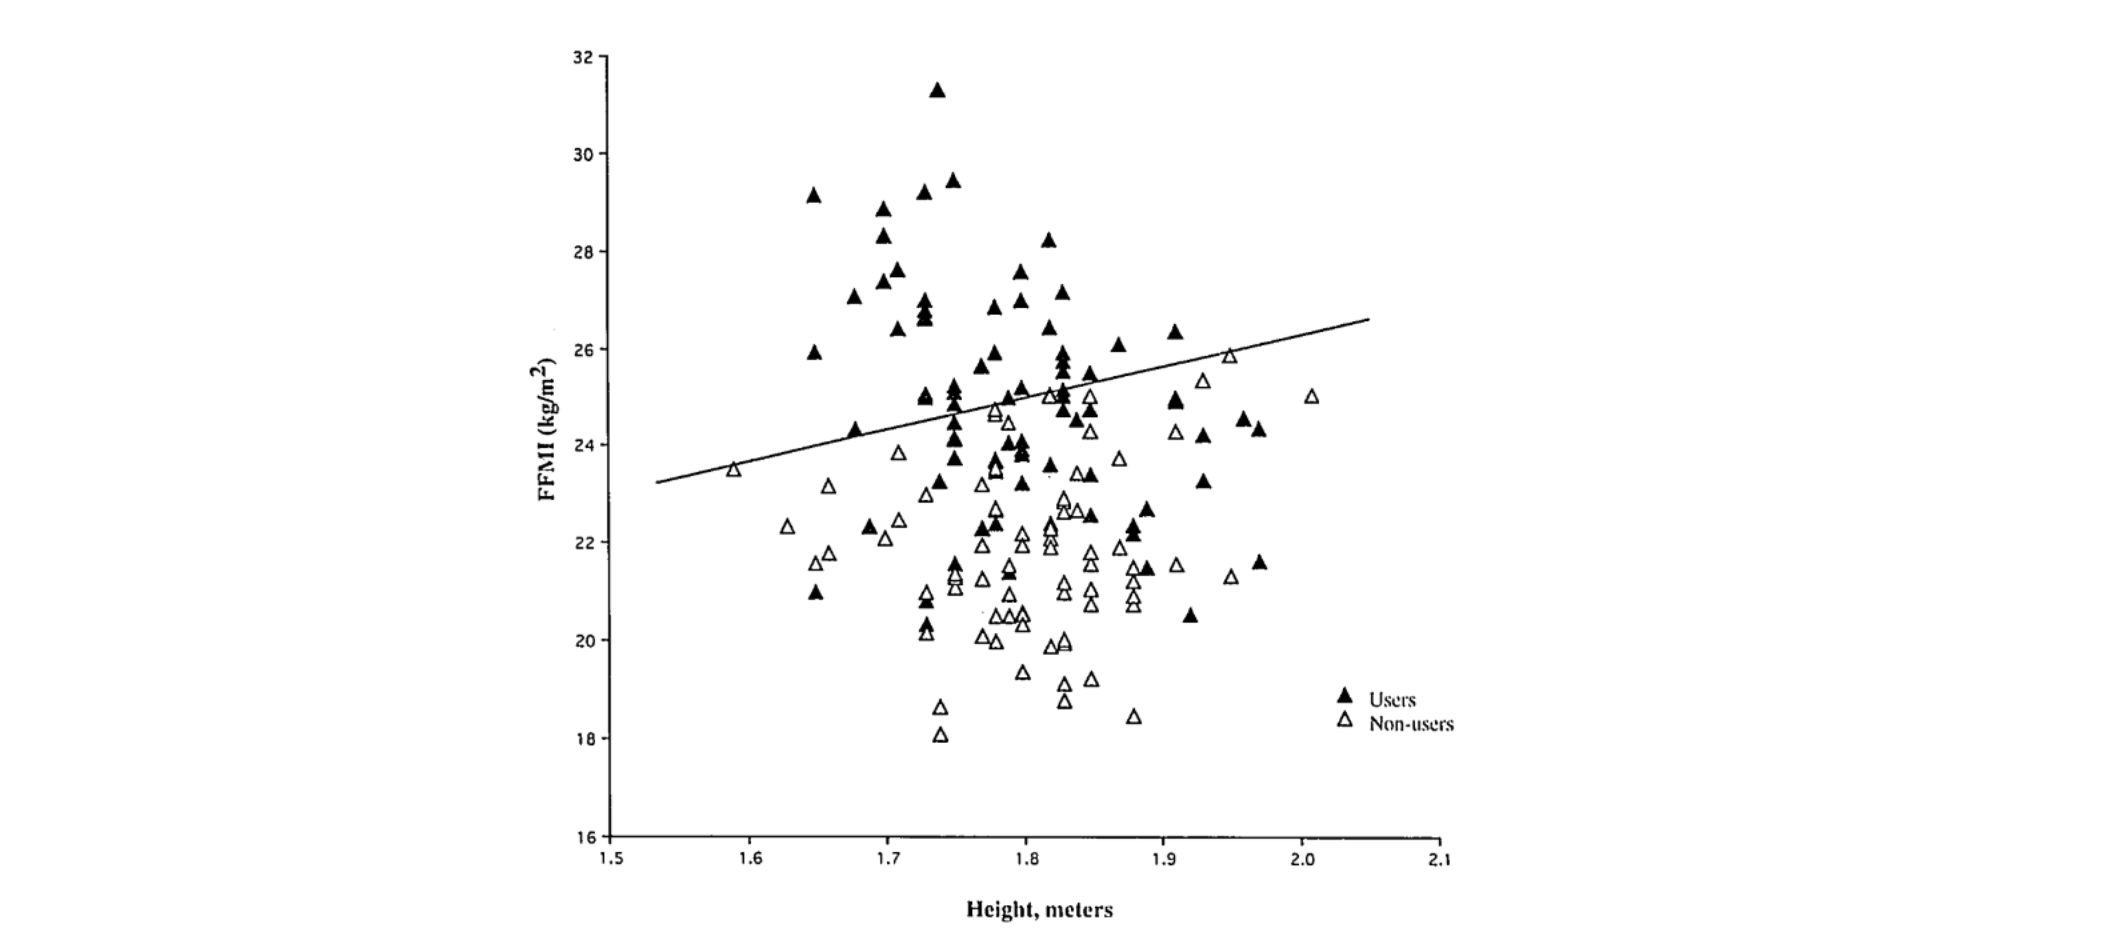
FIGURE 3
FFMI versus height in meters for 74 nonusers and 83 users of anabolic-androgenic steroids.
Source: Kouri, Elena M. Ph.D.; Pope, Harrison G. Jr. M.D.; Katz, David L. M.D., J.D.; Oliva, Paul B.A.. Fat-Free Mass Index in Users and Nonusers of Anabolic-Androgenic Steroids. Clinical Journal of Sport Medicine 5(4):p 223-228, October 1995.
But rules were meant to be broken, and a 25 natural limit for people could be a mistake. The researchers acknowledge this fact. The following table contains the reported FFMIs of pre-steroid-era bodybuilders. As you can see in TABLE 2, 13 of 19 had FFMIs over 25.
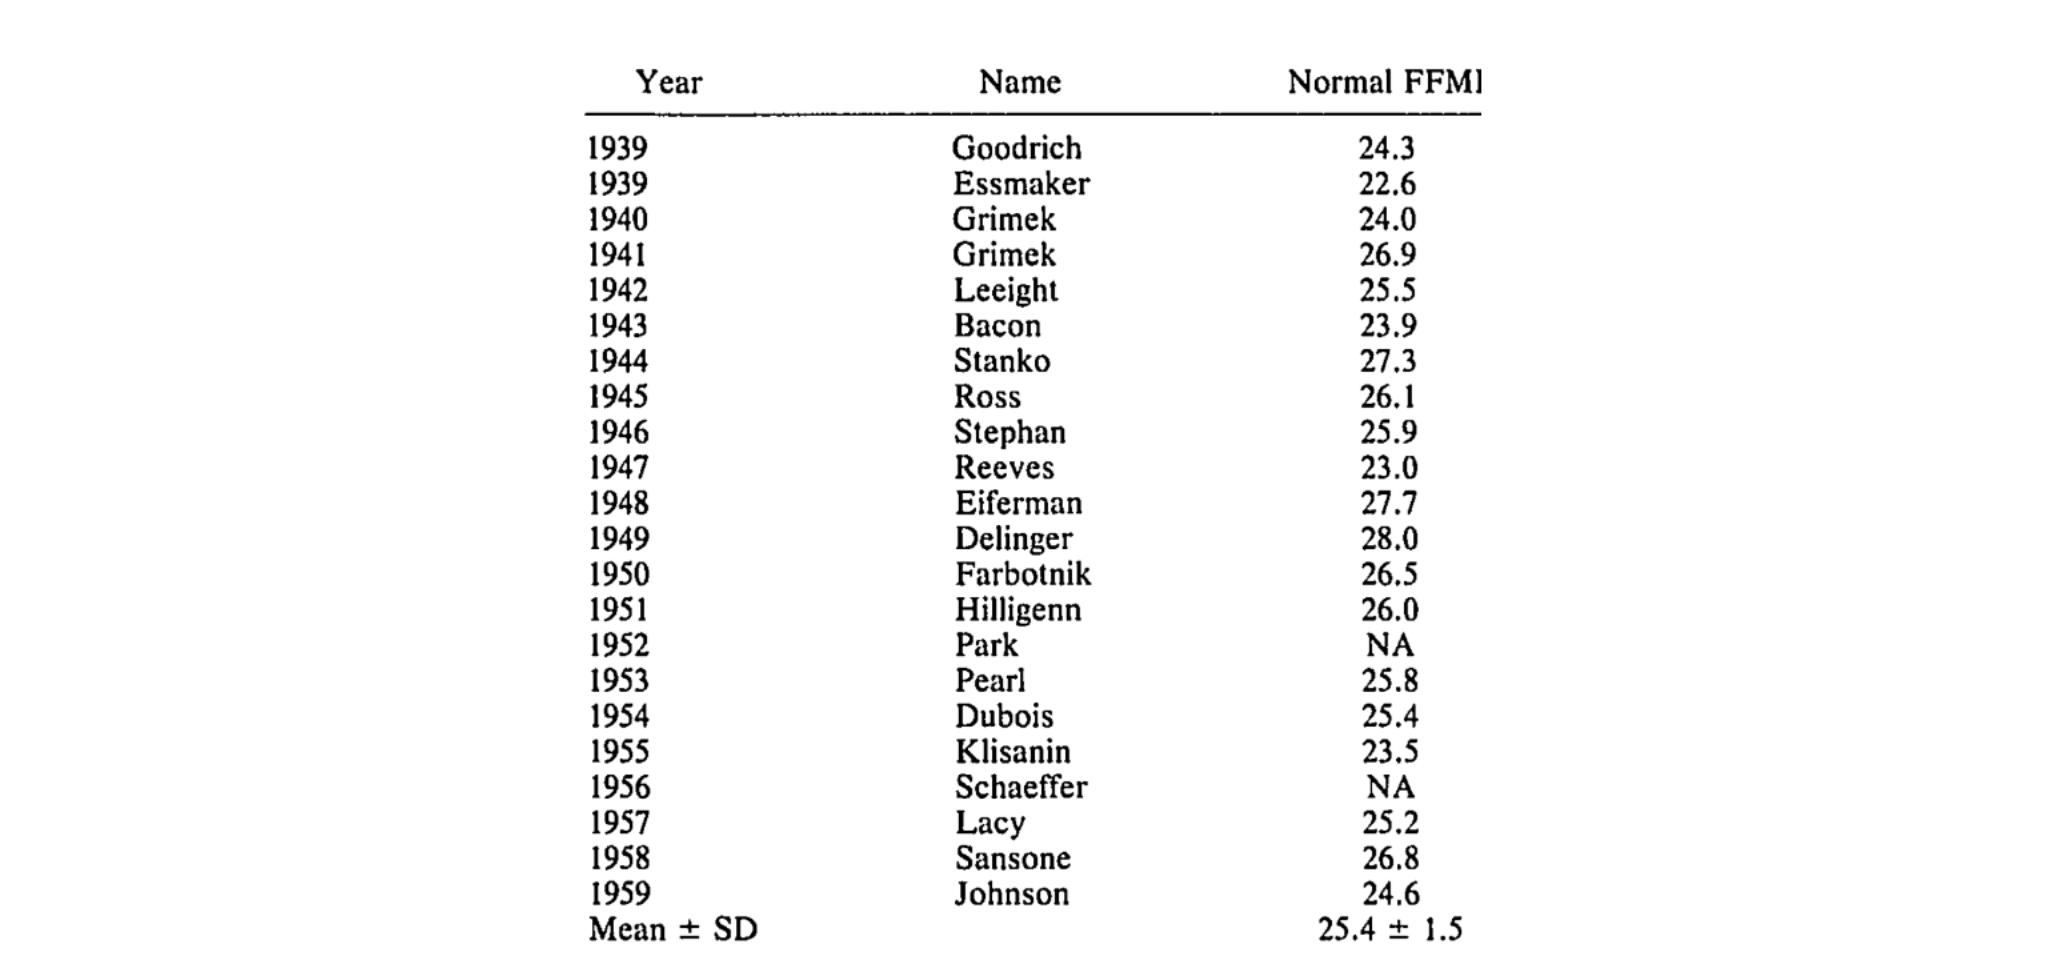
TABLE 2
Estimated normalized FFMIs of Mr. America Winners, 1939-1959
Source: Kouri, Elena M. Ph.D.; Pope, Harrison G. Jr. M.D.; Katz, David L. M.D., J.D.; Oliva, Paul B.A.. Fat-Free Mass Index in Users and Nonusers of Anabolic-Androgenic Steroids. Clinical Journal of Sport Medicine 5(4):p 223-228, October 1995.
Most of us aren’t Mr. America, but it seems sure that John Grimek in 1941 was not on the juice, and was still able to produce an impressive FFMI of 26.9. Furthermore, the authors of the study explained that there were methodological limitations. For example, the non-users might have not disclosed that they were on PEDs (performance-enhancing drugs) when in fact they were. Also, while a sample size of 74 non-users may be appropriate for research in this field, it may not be representative of populations other than Mr America winners. Lastly, body fat percentage measurements are often inaccurate. So, the fat-free mass numbers, and thus the FFMI calculation, could be off.
While useful, FFMI is not a perfect model for assessing muscle potential. Individuals with more fat will likely have a higher FFMI. This is because adipose tissue not only contains fat but also water, connective tissue, and organelles, such that someone with a relatively high amount of adipose tissue has adipose tissue containing around 85% fat by volume, while someone with relatively less adipose tissue has adipose tissue with around 50% fat by volume. For example, think of a 6-foot male weighing 180 lbs who is at 10% body fat. His FFMI will be 22. However, if he gains 50lbs and is now 230 but maintains his muscle mass, of that additional 50lbs, a lot of it will be fat, but there will also be more water retention as well. So, his FFMI may be closer to 23.5, despite having the same amount of muscle.
Steroids could roughly add about 3 FFMI points to what your natural muscle limit is. If this is the case, an additional 15-25 pounds of lean mass could result when deciding to start a normal steroid cycle. However, the strength and quantity of steroids that today’s top bodybuilders use elicit even stronger results. Today it is not uncommon to see top bodybuilders having an FFMI of 35 or above. Practically speaking, if you have an FFMI of 18, and you have never seriously resistance trained before. You can reasonably expect to add about 30-50 lbs of lean mass over the course of your lifting career.
While there are clear benefits of the FFMI model: it is well-researched, has a simple calculation, easy to compare values across athletes, and predict training potential, it is not without its faults. It has limited accuracy and only gives us a general rule of thumb to predict potential.
MUSCLE-TO-BONE RATIO
We’ve identified some pros and cons of the FFMI model. There may be a more accurate predictor of muscle potential than FFMI, and it has to do with your skeletal frame. The idea is that the more bone you have, the more muscle it can support. This idea was made popular by anthropometrics researcher Francis Holway (great name). He uses an analogy of a bookshelf. Imagine a 12-inch bookshelf that is able to support 40 lbs of books. If the bookshelf is increased by 3 inches, the shelf itself only weighs a little bit more, but it is now able to support 10 more pounds. It’s the same idea if you w replace the bookshelf with bones and replace books with muscle.
Holway measured the muscle-to-bone ratio of thousands of elite athletes and found that for each kilogram of bone, a maximum of 5 kg of muscle in men and 4 kg in women can be supported. A 5:1 ratio is a good place to gauge what a natural limit of muscle can be for an individual. However, outliers exist, and Holway’s database does include athletes who have ratios of 5.5:1. The 5:1 ratio is supported by a 2002 study by Chumlea et al. that found that the size of someone’s frame correlates with how much fat-free mass they have (11). There was also a 1994 study that found that people who are a larger frame were able to gain more muscle than their smaller-framed counterparts (12). Anecdotally, bone mass has been used as a predictor for meat yield from livestock for almost a hundred years. And if it’s good enough for the cows, why shouldn’t it be good enough for gym bros?
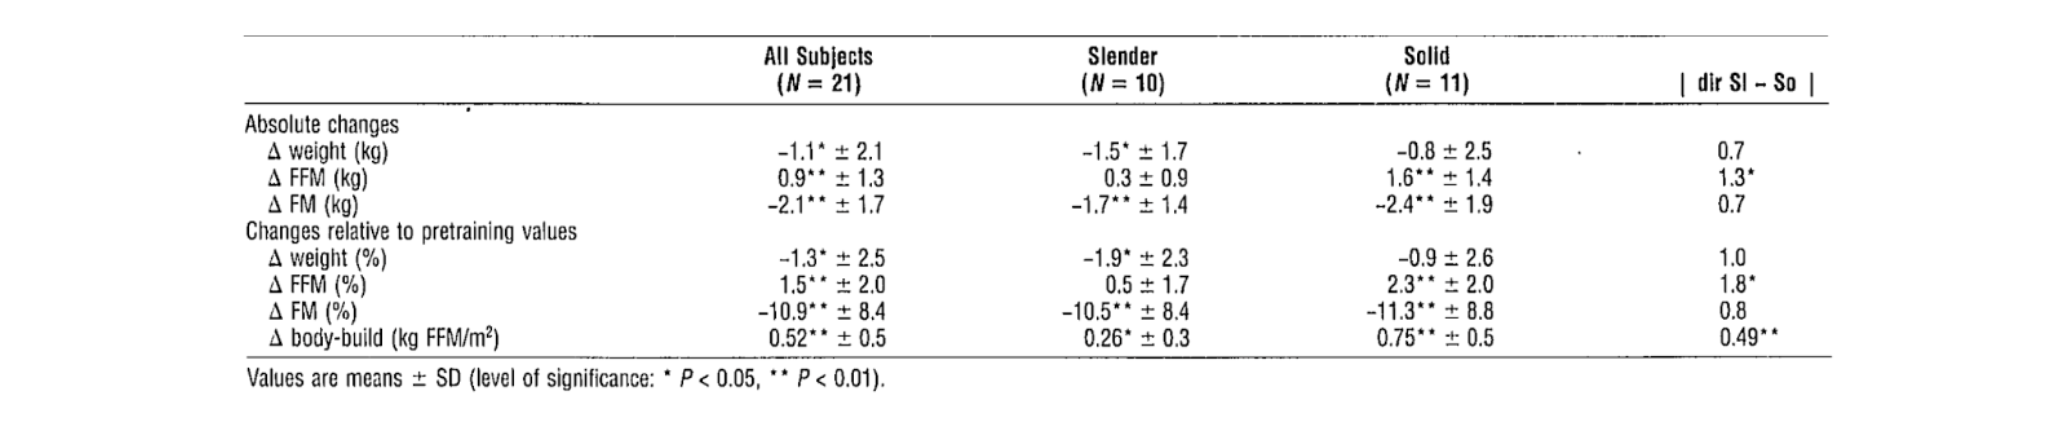
TABLE 3
Changes in weight, fat-free mass (FFM), fat mass (FM), and body build after 12 wk of weight training
Source: Van Etten LM, Verstappen FT, Westerterp KR. Effect of body build on weight-training-induced adaptations in body composition and muscular strength. Med Sci Sports Exerc. 1994 Apr;26(4):515-21.
The key advantage of using muscle-to-bone ratio instead of FFMI is that FFMI does not account for the width or the total frame of an individual. This is identified in the Van Etten study. It also appears to be more accurate at predicting muscle potential. The key disadvantage to using a muscle-to-bone ratio is that it is difficult to measure bone mass. As of now, there are two accurate ways to measure bone mass. The first relies on taking 22 different measurements performed by and calculated by a trained professional, which is what Holway did. The other is an autopsy, which would be ill-advised for long-term gains. If you were thinking that DEXA was useful to calculate bone mass, you’d be wrong. The bone mass reading you get from DEXA is the bone’s “dry weight”. “Dry weight” means the mineral content of the bone, not the entire weight of the bone. This means that is not applicable to this model. While DEXA is good at population levels, individuals have way too much variance. A 2004 study from Wouter found that individuals getting a DEXA had a margin of error of -5 to +7% (13). So even if you were able to get a DEXA reading, the chance of yours being accurate is low.
Another crucial aspect to consider in the realm of muscle potential and overall health is the pivotal role of resistance training in maintaining bone mass as individuals age. As we grow older, our bones naturally weaken, a process often accelerated by conditions like osteoporosis. This decline in bone health not only jeopardizes structural integrity but also compromises the ability of our skeletal frame to adequately support existing muscle mass. Sarcopenia, coupled with the gradual age-related loss of muscle tissue (sarcopenia), underscores the interconnected nature of bone and muscle health. Therefore, beyond mere aesthetics or performance, prioritizing resistance training becomes imperative in mitigating the effects of bone loss and preserving overall musculoskeletal function, particularly in older adults. By engaging in targeted resistance exercises, individuals not only enhance muscle strength and mass but also fortify the foundation upon which their physical health rests, ultimately fostering a more resilient and functional framework throughout the aging process.
WRIST AND ANKLE CIRCUMFERENCE
So far, we have two ways to predict muscle potential. One is more practical but less accurate; the other is less practical but more accurate. There is a third option that splits the difference. Interestingly, there appears to be a strong relationship between wrist circumference and muscular potential, according to the 2002 study from Chumlea previously (11).
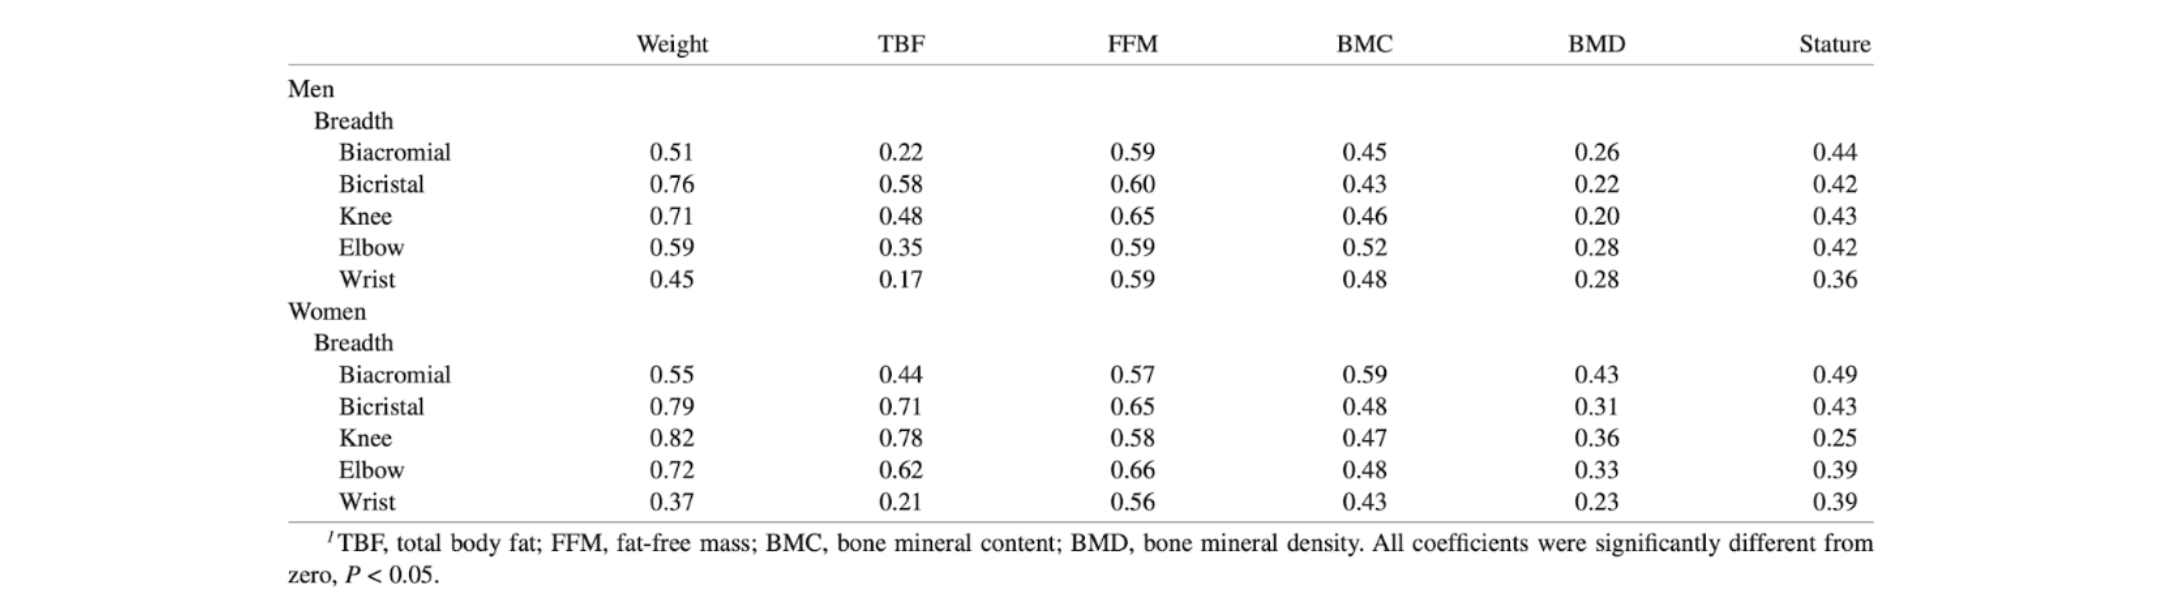
Table 4
Significant age-adjusted Pearson correlation coefficients between frame-size measures and weight, statue, and body-composition measures1
Source: Chumlea WC, Wisemandle W, Guo SS, Siervogel RM. Relations between frame size and body composition and bone mineral status. Am J Clin Nutr. 2002 Jun;75(6):1012-6.
According to the researchers, “In the men, broad hips and knees and narrow wrists were significantly associated with high TBF, whereas broad shoulders, knees, and wrists were significantly associated with high FFM…In the women, broad hips, knees, and elbows, and narrow wrists were significantly associated with high TBF. As in the men, broad shoulders, knees, and wrists were also significantly associated with high FFM '' (11). Where TBF is total body fat, and FFM is fat-free mass. So it suggests that wrist circumference is a key indicator in determining the relationship between body frame size and levels of fat and muscle. The information suggests that with a wider wrist one is more likely to have lower TBF and higher FFM compared to small-wristed individuals. Another study from 1993 found that ankle circumference also had a strong correlation with muscular potential, concluding that ankle circumference may be a better predictor of muscular potential than other structures of the body (14). This idea was popularized by Dr. Casey Butt, who created a calculator to use here to estimate muscular potential.
GENETIC LIMITATIONS
Picking the right set of parents will be important for dictating how much muscle you’ll be able to develop, even if it is as simple as what your fiber type distribution looks like. If you have higher amounts of Type I muscle fibers, there will be less potential for them to get bigger compared to someone who has a higher amount of Type II muscle fibers.
Beyond that, an individual can have mutations in their genes that regulate how much muscle can grow. Myostatin is a great example of this. Myostatin is a protein produced and released by muscle cells that acts as a negative regulator of muscle growth and differentiation. It plays an important role in controlling the size of muscles, as it inhibits muscle cell proliferation and differentiation, ultimately limiting muscle growth (15). So, if you are genetically disposed to having lower levels of myostatin, you will be able to add much more muscle mass than someone with higher levels. Furthermore, genetic alterations in structural and cytoskeletal proteins are known to regulate muscle size (16). This would affect exercise capacity and daily living activities, implying that genetics play a role in muscle hypertrophy as well as atrophy.
GEOMETRY
Of the potential limitations in muscle hypertrophy, limitations in the geometry of the muscle are probably the most theoretical, but are of interest. To help explain this, let’s take a look at what a muscle fiber looks like.
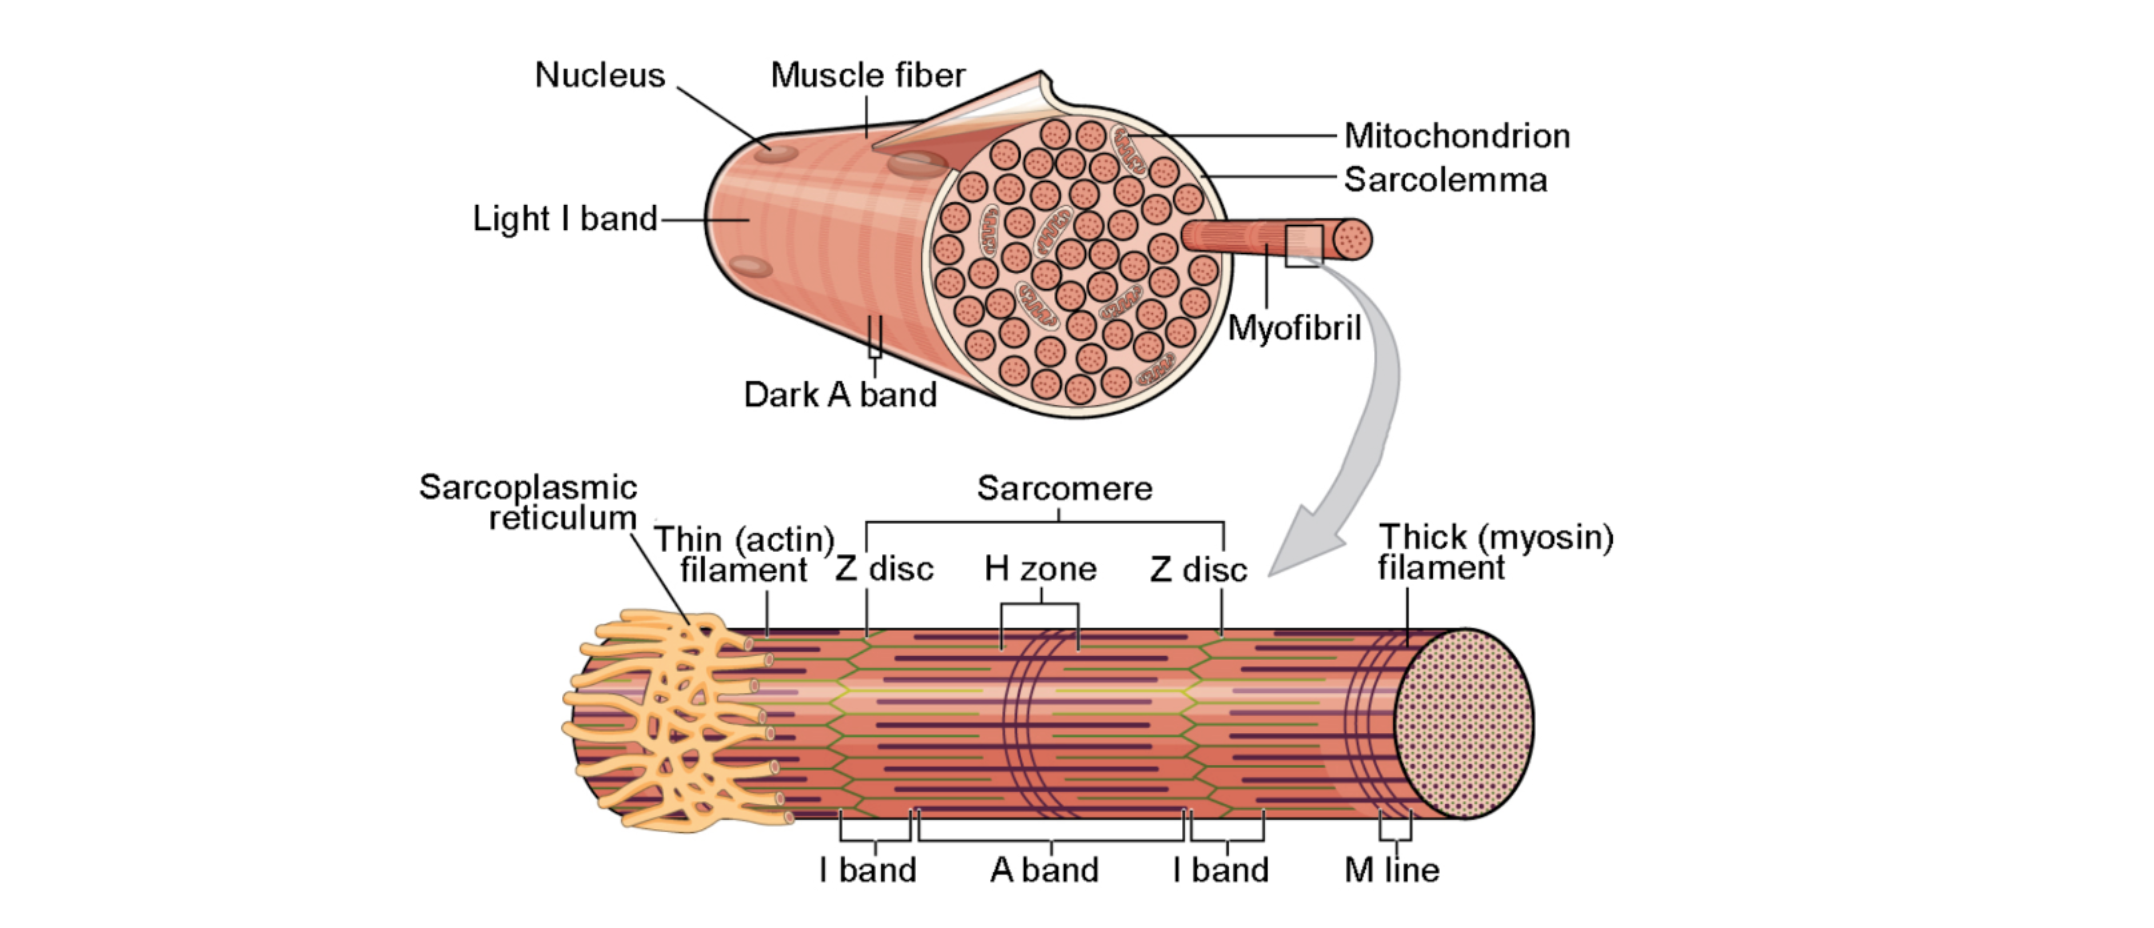
The structure strongly resembles a cylinder. To illustrate my point, we need to remember 2 formulas from high school geometry. The first is the surface area of a cylinder, which is A = 2πr² + 2πrh, where A is the area of the cylinder, r is the radius, and h is height. The second formula is the volume of a cylinder, which is V = πr²h, where V is the volume of the cylinder.
Let’s imagine that we double the radius of the cylinder (height can’t change since you can’t make muscle fibers longer). That would mean that the surface area would increase by a little over double. But if we doubled the radius, we would also increase the volume by about fourfold. So, the bigger a muscle gets, the ratio of surface area to volume decreases.
Why is this important for muscle growth? Well, the body needs to transport the oxygen that is necessary for energy production in the muscle, specifically to the capillaries near the surface of the exterior of the fiber. This means that as a muscle gets larger and larger, the average diffusion distance increases from the capillaries to the mitochondria. The same process would happen but in reverse for metabolites and cellular waste products that are leaving the muscle fiber. In simpler terms, the bigger your muscles get, the harder it is for them to keep getting bigger.
TAKEAWAYS AND RECOMMENDATIONS
It appears that there are a lot of variables at play that will limit how much muscle we are able to develop, including age, training status, fat-free mass index, bone mass, wrist/ankle circumference, and possibly geometry. While each methodology has its pros and cons, understanding these variables will help us manage expectations and make realistic training goals in our lifting career.
That said, plenty of progress can be made before we ever approach our natural limit. I have never known anyone who has seriously hit the gym for an extended period of time on a structured training program who has not made significant muscle gains. I am about 15 years into making lifting an integral part of my life, and while progress isn’t as quick as it used to be, I am still able to make measurable progress.
Practically, I’d say if hypertrophy is your main goal, getting at least 3 training sessions a week in, aiming for about 20 sets per body part in the 6-20 rep range is my professional recommendation. I’d also make sure that you are in a calorie surplus and eating about 1 gram of protein per pound of body weight per day. If you don’t notice meaningful progress in about 3 months, you can increase your training volumes. If you still don’t notice progress, you may want to consult with a knowledgeable strength and conditioning coach (shameless plug).
Sources:
Schiaffino, S., Dyar, K., Ciciliot, S., Blaauw, B., & Sandri, M. (2013). Mechanisms regulating skeletal muscle growth and atrophy. The FEBS Journal, 280.
Pearson, S.J., Hussain, S.R. A Review on the Mechanisms of Blood-Flow Restriction Resistance Training-Induced Muscle Hypertrophy. Sports Med 45, 187–200 (2015).
Schoenfeld, B. (2010). The mechanisms of muscle hypertrophy and their application to resistance training.. Journal of strength and conditioning research, 24 10, 2857-72 .
Wackerhage, H., Schoenfeld, B., Hamilton, D., Lehti, M., & Hulmi, J. (2019). Stimuli and sensors that initiate skeletal muscle hypertrophy following resistance exercise.. Journal of applied physiology, 126 1, 30-43 .
Verdijk, L., Gleeson, B., Jonkers, R., Meijer, K., Savelberg, H., Dendale, P., & Loon, L. (2009). Skeletal muscle hypertrophy following resistance training is accompanied by a fiber type-specific increase in satellite cell content in elderly men.. The journals of gerontology. Series A, Biological sciences and medical sciences, 64 3, 332-9 .
Degens, H. (2012). Determinants of Skeletal Muscle Hypertrophy and the Attenuated Hypertrophic Response at Old Age. Journal of Sports Medicine & Doping Studies, 2012.
Hubal, M., Gordish-Dressman, H., Thompson, P., Price, T., Hoffman, E., Angelopoulos, T., Gordon, P., Moyna, N., Pescatello, L., Visich, P., Zoeller, R., Seip, R., & Clarkson, P. (2005). Variability in muscle size and strength gain after unilateral resistance training.. Medicine and science in sports and exercise, 37 6, 964-72 .
Seynnes, O., Boer, M., & Narici, M. (2007). Early skeletal muscle hypertrophy and architectural changes in response to high-intensity resistance training.. Journal of applied physiology, 102 1, 368-73 .
Häkkinen, K., Komi, P., Alen, M., & Kauhanen, H. (2004). EMG, muscle fibre and force production characteristics during a 1 year training period in elite weight-lifters. European Journal of Applied Physiology and Occupational Physiology, 56, 419-427.
Kouri, Elena M. Ph.D.; Pope, Harrison G. Jr. M.D.; Katz, David L. M.D., J.D.; Oliva, Paul B.A.. Fat-Free Mass Index in Users and Nonusers of Anabolic-Androgenic Steroids. Clinical Journal of Sport Medicine 5(4):p 223-228, October 1995.
Chumlea WC, Wisemandle W, Guo SS, Siervogel RM. Relations between frame size and body composition and bone mineral status. Am J Clin Nutr. 2002 Jun;75(6):1012-6.
Van Etten LM, Verstappen FT, Westerterp KR. Effect of body build on weight-training-induced adaptations in body composition and muscular strength. Med Sci Sports Exerc. 1994 Apr;26(4):515-21.
Van Marken Lichtenbelt WD, Hartgens F, Vollaard NB, Ebbing S, Kuipers H. Body composition changes in bodybuilders: a method comparison. Med Sci Sports Exerc. 2004;36(3):490-497. doi:10.1249/01.mss.0000117159.70295.73
Peters DM, Eston R. Prediction and measurement of frame size in young adult males. J Sports Sci. 1993 Feb;11(1):9-15.
Schuelke, M., Wagner, K., Stolz, L., Hübner, C., Riebel, T., Kömen, W., Braun, T., Tobin, J., & Lee, S. (2004). Myostatin mutation associated with gross muscle hypertrophy in a child.. The New England journal of medicine, 350 26, 2682-8.
Kasper, C. (2011). Skeletal Muscle and Genetics. Annual Review of Nursing Research, 29, 191 - 203.
DISCLAIMER
The information in this article is for educational and informational purposes only and is not intended as medical advice, diagnosis, or treatment. Always consult with a qualified healthcare provider or medical professional before beginning any new exercise, rehabilitation, or health program, especially if you have existing injuries or medical conditions. The assessments and training strategies discussed are general in nature and may not be appropriate for every individual. At Verro, we strive to provide personalized guidance based on each client’s unique needs and circumstances.