Stronger But Same Scan: Why Your Body Composition Scan Isn’t Changing
Strength and muscle size are related, but they are not the same adaptation. Over 4–16 weeks, your nervous system, tendons, coordination, and muscle “quality” can improve significantly, increasing strength, even if skeletal muscle mass on a high quality body composition analyzer remains relatively unchanged. A flat scan doesn’t mean nothing has happened. It usually means the changes are either neural, gradual, or simply smaller than the device’s short-term detection threshold. Sometimes more data needs to be collected before drastic interventions are needed.
Introduction
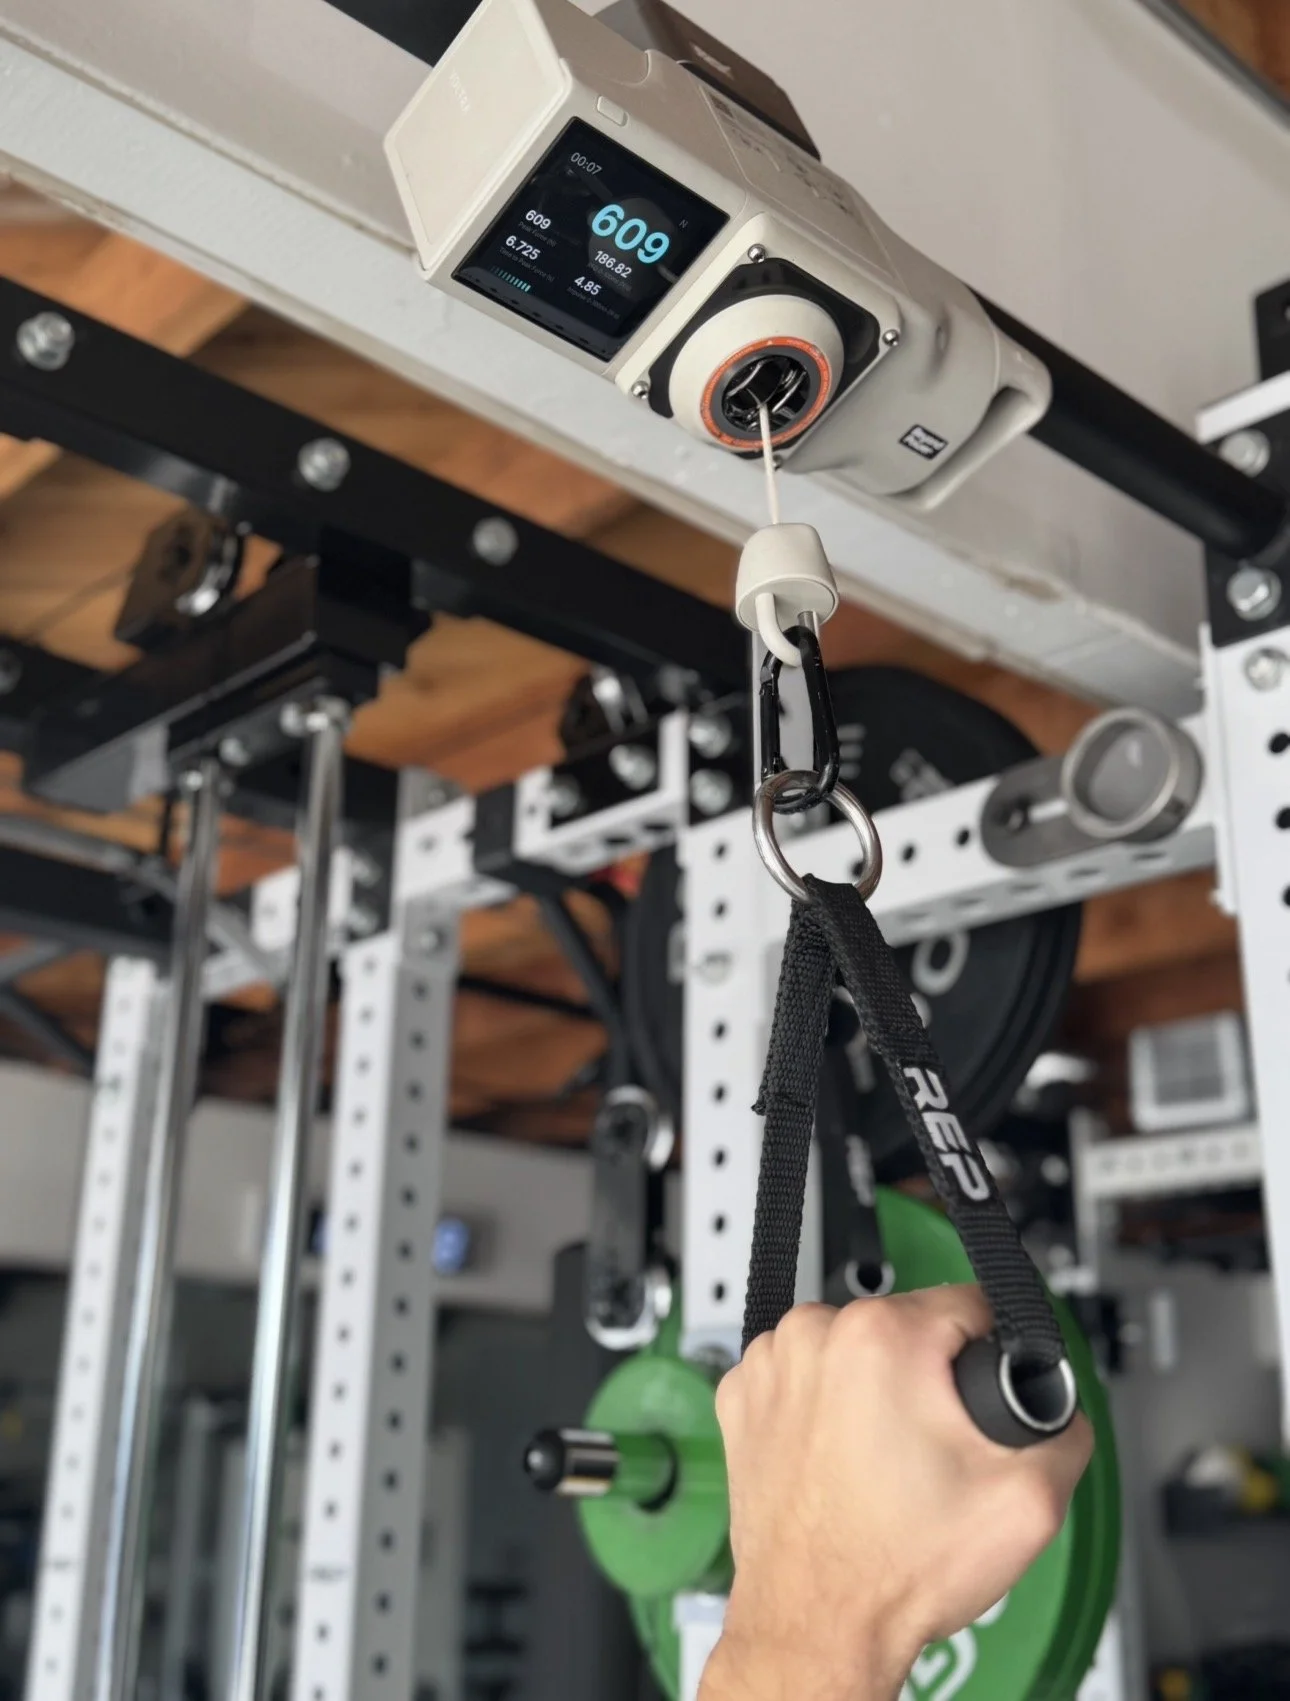
We’ve had the InBody 970S at Verro for over six months now. It’s kind of like your really smart college roommate who stays in the corner but every once and awhile spits out some really valuable useful information. So far, we’ve found data endlessly fascinating. Clients have been losing fat and gaining muscle at an impressive clip.
The 970S is a standing, segmental, multi-frequency bioelectrical impedance analyzer. This means it measures how electrical current travels through different tissues to estimate fat mass, fat-free mass, skeletal muscle mass, and fluid distribution. But occasionally something happens that throws people off.
For example: all a client’s lifts are climbing, their estimated 1RMs are up, they feel stronger, their program ends, and then we scan them. But their InBody remains largely unchanged. No big jump in skeletal muscle mass, and body fat roughly the same. Weight stable. So what’s happening? Is the InBody wrong? Are the strength gains “fake”? Is muscle not actually being built? Maybe, but let’s put this in context.
The InBody Is Not a Lie Detector, It’s a Trend Tracker
The InBody 970S is a high-quality, multi-frequency, segmental BIA device. Research on similar DSM-BIA systems (like the InBody 770) shows strong test–retest reliability for fat-free mass and skeletal muscle mass when testing conditions are standardized (Ling et al., 2011; Sergi et al., 2015).
But reliability is not the same as infinite sensitivity.
Every measurement tool has error. For multi-frequency BIA devices:
Fat-free mass typical error is often ~0.5–1.5 kg.
Body fat percentage error can be ~1–2% absolute.
Small fluctuations in hydration can shift lean mass estimates.
(Kyle et al., 2004)
That means if your skeletal muscle mass increases by 0.5 lb over 6 weeks, the device may not reliably detect that change. It may fall inside normal measurement noise. I will say that the 970s is a bit better than the BIA devices used from Kyle, but it is not perfect.
However, even if the InBody were perfectly accurate…strength can still increase without increases in muscle mass.
Strength Is Not the Same Thing as Muscle Size
Strength is force production, which is mostly neurological. Hypertrophy is tissue growth, which is physiological. They overlap, but they are not identical adaptations. And the amount of muscle growth that you can grow in 4-16 weeks is actually pretty small, even in optimal conditions.
1. Neural Adaptations: The Nervous System Gets Better First
In the early phase of resistance training (roughly 0–6 weeks, sometimes longer), strength gains are largely neural (Moritani & deVries, 1979; Folland & Williams, 2007).
What changes?
You recruit more motor units.
Those motor units fire faster (rate coding).
Antagonist muscles relax more efficiently.
Coordination between muscle groups improves.
Technique becomes more efficient.
You’re not necessarily adding contractile tissue yet. You’re just getting better at using what you already have. Meta-analyses confirm that strength increases often outpace hypertrophy, particularly in novices (Grgic et al., 2018). So if someone adds 30 pounds to their squat in 8 weeks, but skeletal muscle mass is flat? That is completely consistent with physiology.
2. Tendons and Muscle Architecture Improve Force Transmission
Strength doesn’t depend only on muscle size. It depends on how well force is transmitted. Resistance training increases tendon stiffness, which is a good thing (Kubo et al., 2007). A stiffer tendon transfers force more efficiently from muscle to bone.
Muscle architecture can also change:
Pennation angle can increase.
Fascicle behavior can adapt.
These changes improve force output without necessarily increasing total muscle mass.
So again, if force production goes up, but InBody stays roughly the same, that’s not a contradiction.
3. Muscle “Quality” Can Improve Without Size Change
Strength is influenced by specific tension (force per unit of muscle). Intracellular changes (contractile protein packing, neuromuscular efficiency) can increase force output without dramatic increases in cross-sectional area (Folland & Williams, 2007).
The InBody 970s also reports phase angle, which reflects properties of cell membranes and fluid distribution. Higher phase angle has been associated with better functional outcomes in various populations (Norman et al., 2012). Some studies show resistance training can modestly increase phase angle (Marini et al., 2019).
The important takeaway is that a stable skeletal muscle mass reading does not mean the muscle is identical at the cellular level. Muscle usually becomes more efficient before it becomes visibly larger.
4. Small Recomposition Can Cancel Itself Out
Let’s say over 12 weeks someone:
Gains 1 lb of muscle
Loses 1 lb of fat
Net body weight change: zero. But if we factor in measurement error (~1 kg range). That small recomposition can easily appear “flat” on a scan. Furthermore, hypertrophy rates, especially in trained individuals, are modest. Meta-analyses suggest gains are slower than many people expect (Schoenfeld et al., 2016). In other words: You may be changing, just not dramatically enough to exceed the device’s sensitivity window in that timeframe.
5. Glycogen and Water Can Mask Subtle Changes
Every gram of glycogen binds roughly 3 grams of water (Olsson & Saltin, 1970). If training volume increases, glycogen storage patterns shift. If carbohydrate intake fluctuates, intracellular water shifts.
Multi-frequency BIA estimates lean mass partly from total body water (Kyle et al., 2004). That means small fluid changes can subtly influence lean mass readings.
This doesn’t invalidate the device. It just means biology is dynamic.
So is flat and stronger normal?
Very often, especially when:
You’re within the first 8–12 weeks of a new stimulus.
You’re a trained lifter progressing gradually.
You’re not in a caloric surplus.
You’re maintaining body weight.
Strength increases can happen in maintenance calories due to neural efficiency and coordination improvements. Optimal hypertrophy typically requires sufficient protein (≈1.6 g/kg/day or more) and adequate energy intake (Morton et al., 2018). If the goal is purely getting stronger, flat muscle mass is not concerning. If the goal is visible hypertrophy and the scan is flat after 16+ weeks with proper nutrition and standardized testing, that’s when we reassess programming or intake.
When Should You Actually Be Concerned?
Most of the time, flat scans with rising strength are completely normal. But there are situations where a scan-to-scan change deserves attention. The key is understanding what exceeds normal device variability.
How Much Skeletal Muscle Mass (SMM) Loss Is Concerning?
Multi-frequency segmental BIA systems like the InBody 970S typically have lean mass variability in the range of ~0.5–1.5 kg depending on protocol consistency (Ling et al., 2011; Kyle et al., 2004).
That means:
A 0.3–0.5 lb drop in SMM?
→ Almost certainly noise.A 1 lb drop on a single scan?
→ Possibly noise. Check hydration and protocol.A 2+ lb drop (≈1 kg) across two consecutive standardized scans, especially over 8–12 weeks?
→ Now we pay attention.
What would be concerning?
Potential Red Flags:
≥1 kg (2+ lb) SMM loss over 8–12 weeks
Downward trend across 2–3 consistent scans
Strength decreasing alongside SMM
Rising ECW/TBW ratio with declining phase angle
If strength is going up and SMM dips slightly once, it is almost never meaningful. If strength is flat or declining and SMM trends downward across months, that deserves investigation.
How Much Fat Gain Is Concerning?
Similar logic applies: body fat measurements on DSM-BIA devices can fluctuate ~1–2% based on hydration and testing variables.
So:
+0.5–1% body fat on one scan?
→ Normal variability.+1–2 lbs fat mass on one scan?
→ Possibly sodium, glycogen, hydration shifts.Sustained +2–3 lbs fat mass across 8–12 weeks, with body weight trending up?
→ Likely real.
What’s “concerning” depends on goal. If someone is intentionally in a caloric surplus to build muscle, modest fat gain is expected. If someone is in a fat loss phase and gains 2–4 lbs of fat over 8–12 weeks, we reassess intake and adherence.
Before Panicking: The Nutrition & Life Checklist
If a scan looks “off,” we don’t immediately assume physiology is broken. We start with controllables.
Step 1: Are You Training Hard and Consistently?
Progressive overload present?
2–4 high-quality sessions per week?
Sets close enough to meaningful effort?
Strength metrics trending appropriately?
If training stimulus isn’t adequate, body composition won’t change.
Step 2: Nutrition Audit
If SMM is flat or declining and hypertrophy is the goal:
Protein ≥1.6 g/kg/day? (Morton et al., 2018)
Consistent calorie surplus (if mass gain is desired)?
Total calorie intake tracked accurately?
Weekend intake drastically different?
Under-eating unintentionally?
If fat mass is rising unexpectedly:
Portion creep?
Liquid calories?
Alcohol?
Reduced step count?
Late-night snacking?
Stress eating?
Most “mystery scans” are nutrition adherence issues. Not physiology failures.
Step 3: Recovery & Life Factors
Chronic stress and sleep deprivation can influence fluid balance and body composition trends.
Ask:
Sleep ≥7 hours consistently?
Increased life stress?
Travel?
Major schedule disruption?
Significant increase in cardio or step count?
Illness in the last 2–4 weeks?
Fluid retention alone can shift lean and fat readings transiently.
If All of That Is Dialed In… Then What?
If:
Training is consistent and progressive
Protein and calories are appropriate
Sleep is adequate
Scans are standardized
SMM trends downward across multiple months
Strength is declining
Then we consider deeper causes.
When Doctor Intervention Might Be Appropriate
It’s rare, but it happens.
If someone experiences:
Unexplained loss of muscle mass
Persistent fatigue
Declining performance
Unexpected fat gain despite controlled intake
Changes in libido or mood
Hair thinning, menstrual irregularities, or other hormonal signs
It may be appropriate to consult a physician and check:
Thyroid function
Testosterone / estrogen
Cortisol
Iron levels
Vitamin D
Markers of chronic inflammation
Underlying illness
True unexplained muscle loss in someone training hard and eating adequately is uncommon, but it is worth ruling out medical causes if trends persist over several months.
The Bigger Coaching Perspective
The mistake would be reacting emotionally to a single scan. One scan is a snapshot. Two scans show a direction. Three scans show a trend. Twenty scans paints the picture.
At Verro, we interpret the InBody 970S the way it should be interpreted: As one piece of a larger performance puzzle. If strength is rising, training quality is high, recovery is good, and nutrition is appropriate, flat scans over 4–12 weeks are not alarming.
If scans consistently move in the wrong direction despite those variables being controlled, then we investigate intelligently, not emotionally. Because the goal is not to worship the machine. The goal is to understand what your body is doing, and respond accordingly.
References
| Citation (APA) | Study Type | Why It’s High Value | Supports This Claim |
|---|---|---|---|
| Folland, J. P., & Williams, A. G. (2007). The adaptations to strength training: Morphological and neurological contributions to increased strength. Sports Medicine, 37(2), 145–168. | High-quality review | Breaks down neural vs hypertrophic contributions to strength. | Strength can increase without measurable hypertrophy. |
| Grgic, J., et al. (2018). Effects of resistance training on muscle strength and hypertrophy. Sports Medicine, 48, 1207–1220. | Meta-analysis | Large pooled analysis comparing strength and size adaptations. | Strength gains often outpace muscle growth. |
| Moritani, T., & deVries, H. A. (1979). Neural factors vs hypertrophy in strength gain. American Journal of Physical Medicine, 58, 115–130. | Longitudinal study | Classic early-phase strength adaptation research. | Early strength gains are largely neural. |
| Schoenfeld, B. J., et al. (2016). Dose-response relationship between resistance training volume and muscle growth. Journal of Sports Sciences, 35, 1073–1082. | Meta-analysis | Quantifies hypertrophy rates and variability. | Muscle growth is gradual and often modest. |
| Morton, R. W., et al. (2018). Protein supplementation and resistance training: A meta-analysis. British Journal of Sports Medicine, 52, 376–384. | Meta-analysis | Establishes protein intake thresholds for hypertrophy. | Nutrition requirements for muscle gain. |
| Kubo, K., et al. (2007). Effects of resistance training on tendon stiffness. Journal of Applied Physiology, 102, 616–622. | Experimental study | Demonstrates tendon adaptations with training. | Strength increases via improved force transmission. |
| Ling, C. H., et al. (2011). Accuracy of direct segmental multi-frequency bioelectrical impedance analysis compared with DXA. Clinical Nutrition, 30, 610–615. | Validation study | Relevant to InBody-class DSM-BIA devices. | Reliability and validity of segmental MF-BIA. |
| Sergi, G., et al. (2015). Accuracy of multi-frequency bioelectrical impedance analysis for body composition. Clinical Nutrition, 34, 939–944. | Validation study | Confirms MF-BIA reliability under standardized conditions. | Measurement sensitivity and tracking value. |
| Kyle, U. G., et al. (2004). Bioelectrical impedance analysis—Part I & II. Clinical Nutrition, 23, 1226–1243. | Comprehensive review | Foundational MF-BIA methodology and limitations. | Hydration and fluid effects on readings. |
| Norman, K., et al. (2012). Prognostic impact of phase angle in patients. Clinical Nutrition, 31, 854–861. | Systematic review | Links phase angle with functional outcomes. | Phase angle as a tissue quality marker (cautiously interpreted). |
| Marini, E., et al. (2019). Phase angle and muscle function. Clinical Nutrition, 38, 230–237. | Observational study | Associates phase angle with muscle function. | Adjunct interpretation of muscle quality. |
| Olsson, K. E., & Saltin, B. (1970). Variation in total body water with muscle glycogen changes. Acta Physiologica Scandinavica, 80, 11–18. | Experimental physiology | Classic glycogen-water binding research. | Why fluid shifts can affect lean mass readings. |
| Nana, A., et al. (2012). DXA reliability and acute changes in athletes. Journal of Sports Sciences, 30, 735–742. | Reliability study | Demonstrates hydration effects even in DXA. | No body composition method is immune to fluid shifts. |
DISCLAIMER
This article is for educational purposes only and is not intended to diagnose, treat, or replace individualized medical advice. Body composition data from devices such as the InBody 970S should always be interpreted within the broader context of training history, nutrition, recovery, and overall health.
No body composition tool, including medical-grade multi-frequency segmental BIA, is perfectly precise. Small changes from scan to scan may reflect normal biological variation or measurement variability rather than meaningful physiological change.
If you experience unexplained, persistent loss of muscle mass, significant unexpected weight changes, chronic fatigue, or other concerning symptoms, consult a qualified healthcare professional for appropriate evaluation.
At Verro, we use body composition data as one piece of a larger performance and health picture, not as a standalone determinant of progress.